AMIGO Brassboard
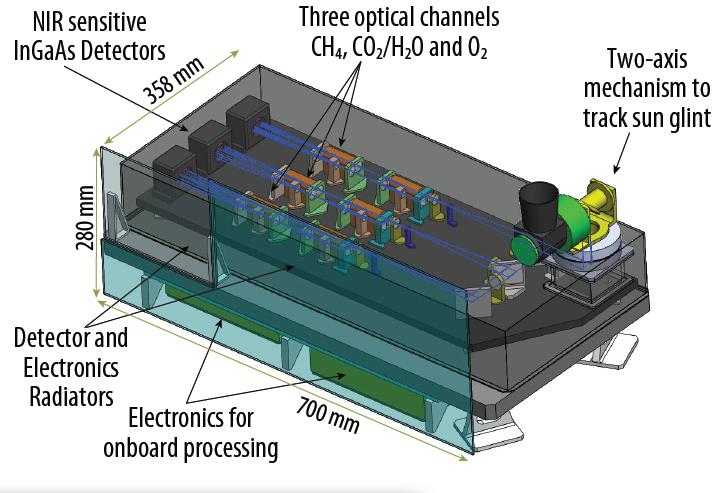
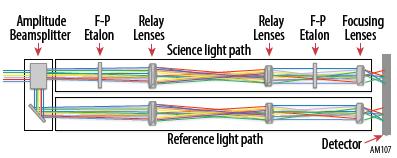
This figure above shows the layout for the space flight version of AMIGO and the schematic below traces the path of light through a single channel of the instrument after the apprpriate wavelength range has been separated by a dichroic mirror.
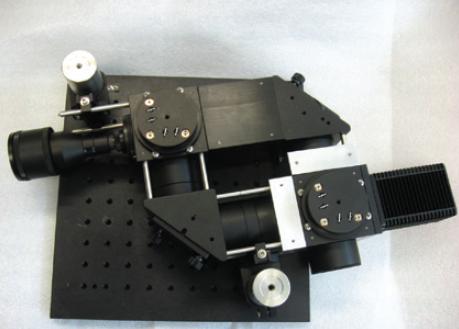
The third figure shows a single methane channel developed here at Goddard for laboratory testing of the AMIGO concept. Light enters the instrument at the upper left via a fiber (not shown) and passes through the bandpass filter. It next is split
with the FP beam continuing straight on passing through the Fabry-Perot housed in the black cube and the REF beam deflected down. A pair of adjustable diagonal mirrors bring the two beams back together where a second beam splitter directs the FP
beam to the right parallel to the REF beam and they both are recorded by the InGaAS array camera located at the far right
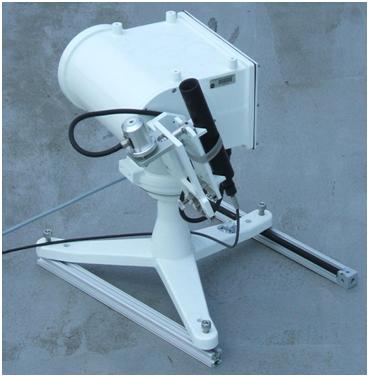
In order to appoximate the image of a glint for this lab instrument we install a sun tracker on the roof (shown in the photo above)that focusses an image
of the sun onto the end of a fiber bundle. Each fiber within
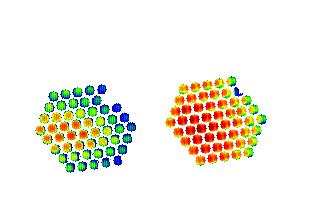
the bundle collects light from a different place on the sun and the instrument forms an image of each fiber in the bundle.The right hand figure shows both
the FP image and the REF image of the fiber bundle with different
intensities displayed as different colors. This is the same scene that AMIGO would see if it passed over an array of circular ponds.The right side image
is the REF and it would be uniform in color except that the fiber
bundle is slightly off the sun so its right edge is darker.
The left (FP) image has a dark edge as well for the same reason but also shows a horizontal line across the image caused by methane absorption. This is
because the Fabry-Perot has mapped the pixels by wavelength and the pixels across the middle of the hexagonal pattern are mapped to wavelengths that are
absorbed by the methane in the atmosphere.
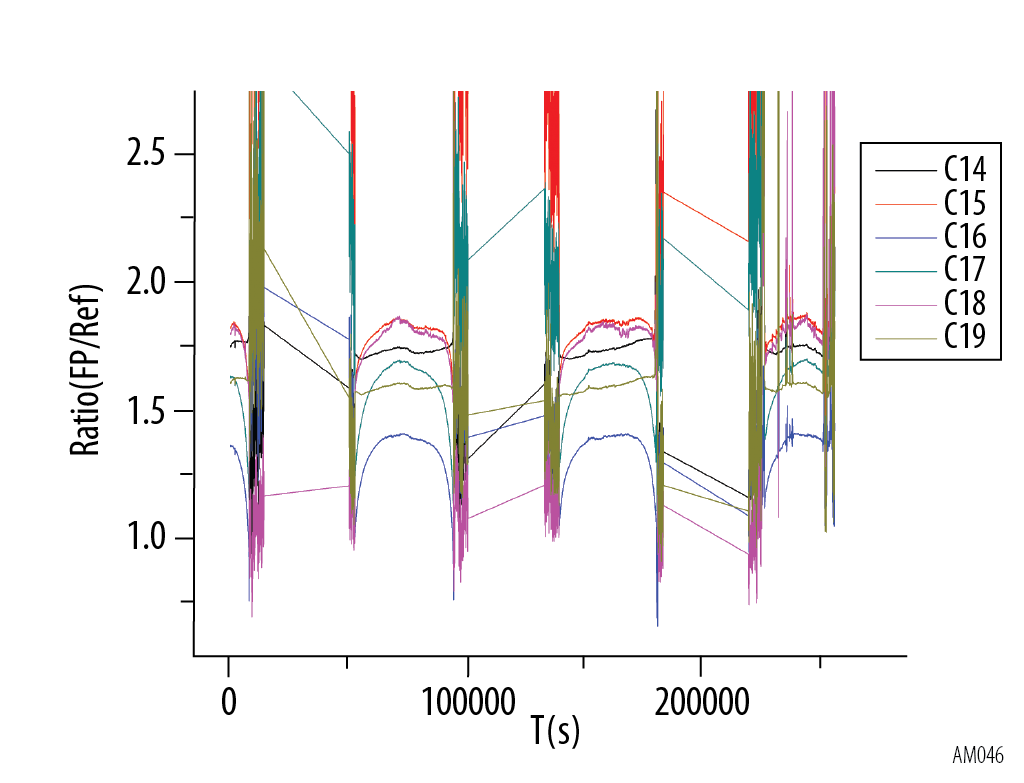
The figure above shows results from roughly 3 days of continuous observation by the suntracker. The traces labelled "C" correspond to different rings in the
Fabry-Perot's mapping the pixels.Zero time begins on the afternoon of March 8, 2012. Rings C15 through C18 show an initial decrease. This is because as the sun
sets the atmospheric path length grows longer and the effect of methane absorption grows stronger. Rings C14 and C19 are not mapped onto a wavelength that methane
absorbs so they do not change. Seconds 1000 through 5500 represent sunset, night when the FP and REF signals are near zero, and then sunrise. During sunrise and
sunset the pahlength becomes very long and the probability of clouds in the path becomes very high. This is why the ratio becomes extremely noisy during
these transitions.During the first full day (March 9) rings C15 - C 18 show in increase during the morning as the atmospheric path lenght grows shorter reaching
a maximum at local noon and then decreasing again in the afternoon as on March 8. Two additional nights and days are shown exhibiting the same pattern. March 11
is very noisy because the day was mostly cloudy. We can calculate the pathlength from the instrument to the sun very precisely. Knowing the wavelength assignments
of the pixels and the methane absorption spectrum would permit an accurate determination of the column methane. The wavelength calibration of the instrument
has not been done yet because the instrument is still undergoing changes to improve optical efficiency and stability. Over the next months these improvements will
be completed and the final calibration will be performed. At that point the AMIGO Brassboard will begin to make routinr measurements of the methane column. Come back
to the website and view the progress.